The 2016 update of the report
The 2016 update of the report shows that 390 financial institutions from around the world invested 498 billion USD into 27 companies involved in the production, maintenance and modernization of nuclear weapons since January 2013.
Download the full Hall of Shame.
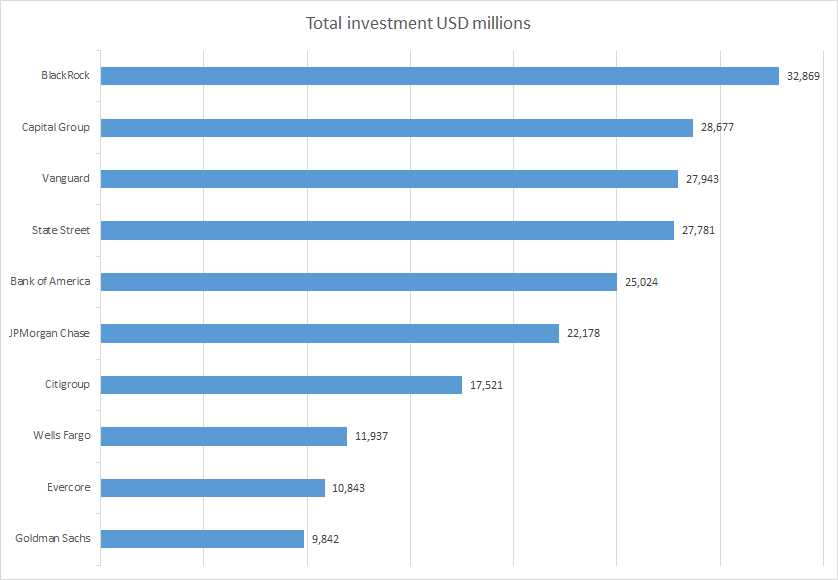
Top 10 investors
This chart shows the 10 financial institutions with the largest total investments since January 2013 in the 27 companies involved in the production, maintenance and modernization of nuclear weapons identified in this report .
2016 Investors, per country
The country profiles are easy to use fact sheets that include a summary of the methodology, the producers list, and more. They provide detailed information on the financial institutions headquartered in each country.
Australia | Bahrain | Belgium | Canada| China| Denmark| France| Germany| India| Israel| Italy| Japan| Jordan| Kuwait| Libya| The Netherlands | Norway | Saudi Arabia | Singapore| Spain| Sweden| Switzerland| Taiwan| United Arab Emirates | United Kingdom |United States
[toggle title=”The 2015 update of the report”]
The 2015 update of the report shows that 382 private and public financial institutions from around the world invested 493 billion USD into 26 companies involved in the production, maintenance and modernization of nuclear weapons since January 2012.
2015 Investors, alphabetically
A | B | C | D | E | F | G | H | I | J | K | L | M | N | O | P | R | S | T | U | V | W | Y
2015 Investors, per country
The country profiles are easy to use fact sheets that include a summary of the methodology, the producers list, and more.
Australia | Austria | Bahrain | Belgium | Canada | Chile | China | Denmark | France | Germany |
India | India | Indonesia | Israel | Italy | Japan | Kuwait | Libya | Macedonia | Netherlands | Norway | Saudi Arabia | Singapore | Spain | Sweden | Switzerland | Taiwan | United Arab Emirates |
United Kingdom | United States
2014 Investors, alphabetically
A | B | C | D | E | F | G | H | I | J | K | L | M | N | O | P | R | S | T | U | V | W | Y
2014 Investors, per country
The country profiles are easy to use fact sheets that include a summary of the methodology, the producers list, and more.
Australia | Austria | Bahrain | Belgium | Canada | China | Denmark | France | Germany |
India | Israel | Italy | Japan | Kuwait | Libya | Netherlands | Norway | Saudi Arabia |
Singapore | South Africa | Spain | Sweden | Switzerland | Taiwan | United Arab Emirates |
United Kingdom | United States
- Australia (PDF)
- Austria (PDF)
- Bahrain (PDF)
- Belgium (PDF)
- Canada (PDF)
- China (PDF)
- Denmark (PDF)
- France (PDF)
- Germany (PDF)
- India (PDF)
- Indonesia (PDF)
- Ireland (PDF)
- Israel (PDF)
- Italy (PDF)
- Japan (PDF)
- Jordan (PDF)
- Kuwait (PDF)
- Netherlands (PDF)
- Norway (PDF)
- Saudi Arabia (PDF)
- Singapore (PDF)
- South Africa (PDF)
- Spain (PDF)
- Sweden (PDF)
- Switzerland (PDF)
- Taiwan (PDF)
- United Arab Emirates (PDF)
- United Kingdom (PDF)
- United States (PDF)
3 comments